The Price of Proximity: Estimating San Francisco’s Muni Metro Housing Premium
A case study of how transit accessibility shapes urban housing markets.
Project Overview
This project investigates how transit accessibility influences housing prices in San Francisco. Using a hedonic pricing model with fixed effects and distance bands, the analysis estimates how proximity to MUNI Metro stations impacts price per square foot while controlling for housing and neighborhood characteristics. Results suggest that accessibility premiums are present but vary with distance and local density, demonstrating that the effects of transit investment are not uniform across the city.
Context & Objectives
Urban economic theory suggests that accessibility plays a central role in determining land values. Classic models such as von Thünen’s Isolated State and Alonso’s bid-rent framework emphasize the trade-offs made between amenities, commuting costs, and housing expenses. In San Francisco, Muni Metro provides critical connections between residential neighborhoods and employment centers, raising important questions about the extent to which station proximity influences property markets.
This analysis has three main goals in mind:
To measure whether properties located closer to MUNI Metro stations have a price premium.
To assess how the effect of accessibility diminishes with distance from a station.
To examine how accessibility premiums vary across different housing submarkets.
Data Sources
The dataset consists of recent home sales (post-COVID) collected from Zillow. Each property was geocoded to measure spatial relationships to transit stations, green spaces, and the Central Business District (CBD). Housing characteristics include bedroom and bathroom counts, while neighborhood socioeconomic conditions are captured through neighborhood violent crime rates and median household income.
Distance to the CBD was incorporated as a key control variable, consistent with Alonso’s (1964) bid-rent model, which predicts declining land values with increasing distance from the employment core. San Francisco’s monocentric urban structure makes this assumption particularly relevant. To account for environmental amenities, the distance to the nearest green or open space was also measured.
Methodology
The analysis applies a hedonic regression model, where the dependent variable is the logarithm of sales price per square foot. This specification that allows coefficients to be interpreted as percentage changes while controlling for property size.
Explanatory variables include housing attributes (bedrooms, bathrooms), neighborhood conditions (median income, crime rates), and spatial measures (distance to CBD, distance to green space). Transit accessibility is measured through categorical distance bands: within ¼ mile of a Muni station (baseline), ¼–½ mile, ½–¾ mile, and beyond ¾ mile. This approach reflects the non-linear decline of accessibility benefits documented in urban economics literature.
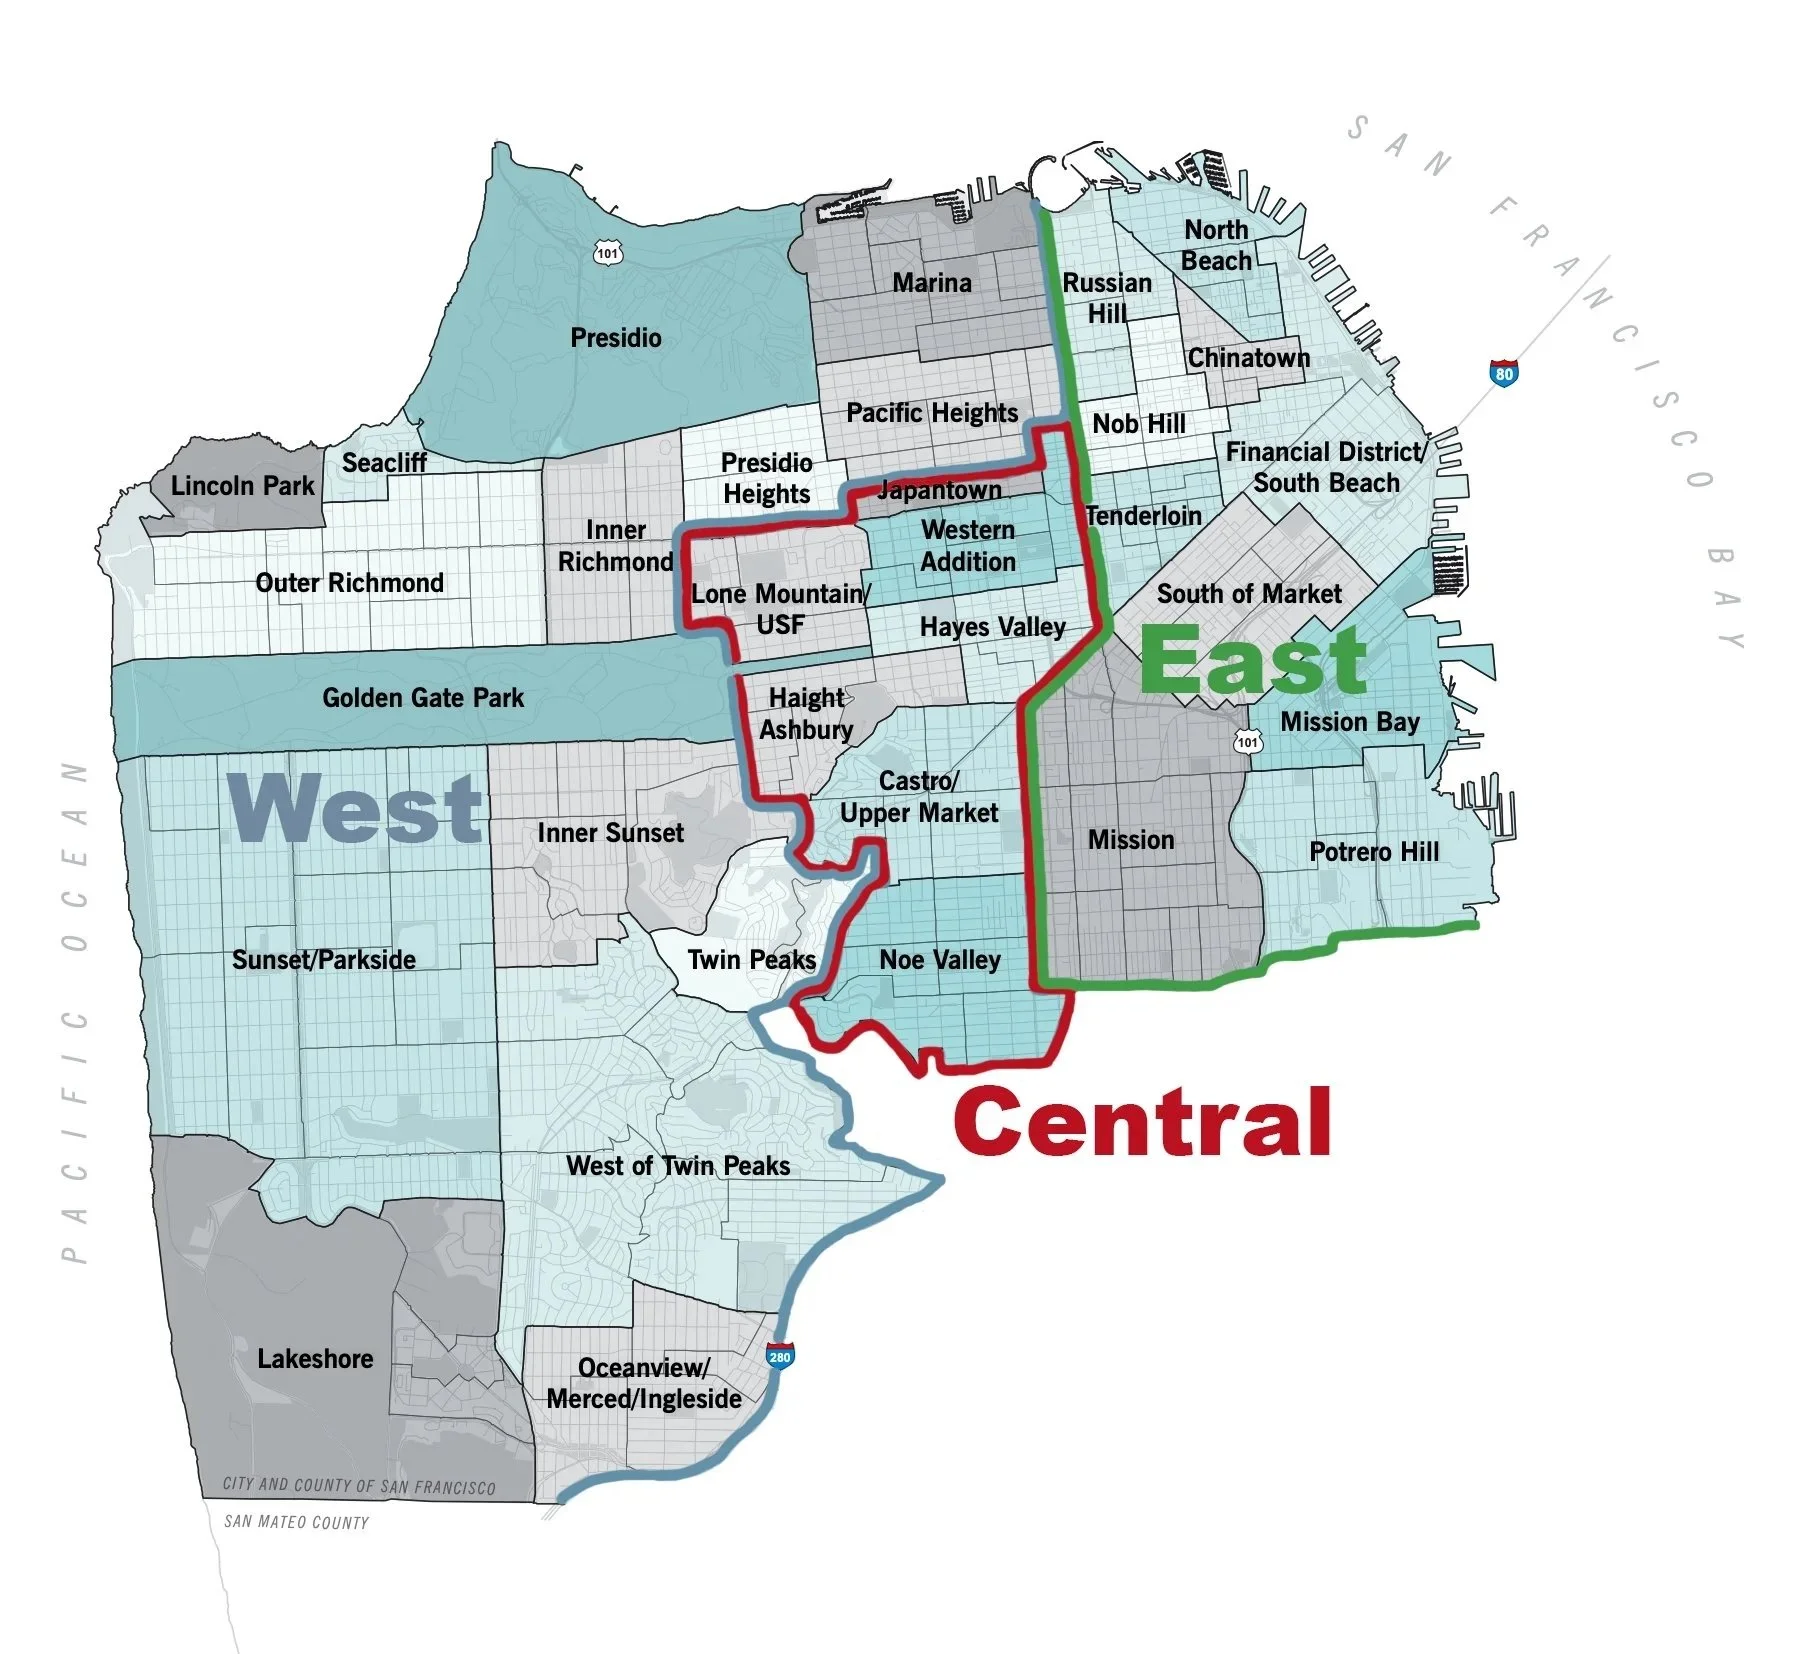
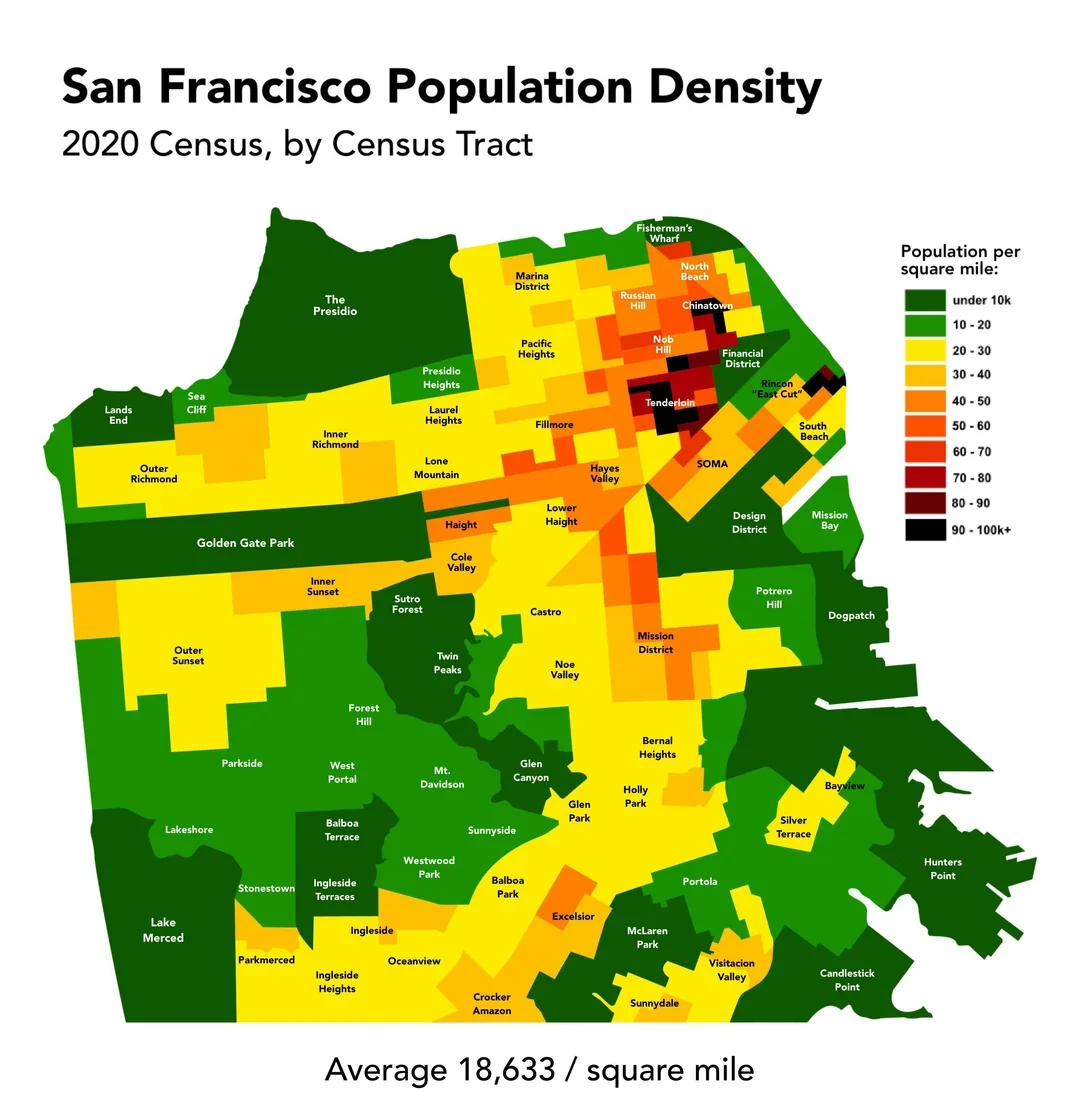
Additional controls include whether the nearest rail line segment is at grade or below grade, to capture externalities such as noise. Fixed effects by sales period are introduced to account for temporal variation in the housing market, ensuring that results reflect accessibility effects rather than citywide housing price trends. For the analysis, SF was split into 3 subregions (West, Central, and East) based on geographic location, defined by neighborhood lines, to see if accessibility premiums differed in each.
Results
The base model for this study is:
log(price_sqft) = bedroom count + bathroom count + 1/4-1/2 mile station distance + 1/2-3/4 mile station distance + 3/4 or more miles station distance + if the nearest line is at grade + distance to green space + household income + violent crime rate
In addition to the independent variables listed above, the base model controls for sale period.
Base Model Results
½–¾ mile away: Homes sold for about 16% less per square foot than those within ¼ mile (99% confidence).
¼–½ mile away: No statistically significant difference from the baseline.
>¾ mile away: No statistically significant difference from the baseline.
These results lack consistent significance across all distance bands, leaving us with mixed evidence regarding Muni Metro premiums when the full city is analyzed together.
I revised the model to separate the data points by SF subregion, and plotted home sale prices vs distance from a Muni station.

Subregional Patterns
The plot reveals that San Francisco’s Western subregion behaves differently than the Central and Eastern subregions. To test this formally, I estimated a revised model that excluded the Western neighborhoods, while keeping the same independent variables and sales-period fixed effects.
Revised Results
¼–½ mile away: Homes sold for about 15% less per square foot than those within ¼ mile (95% confidence).
½–¾ mile away: Homes sold for about 18% less per square foot (99% confidence).
>¾ mile away: Effect becomes insignificant, suggesting that accessibility benefits are hyper-localized around stations. Sparse data at these distances may also contribute to the lack of significance.
Western neighborhoods such as Twin Peaks, Parkside, Lakeshore, and Lake Merced are dominated by lower-density, single-family housing. In contrast, Central and Eastern areas, including Hayes Valley, the Haight, the Mission, North Beach, SOMA, and Nob Hill are denser. These differences in density help explain why Muni Metro premiums are stronger in the Central/East and weaker in the West.
Conclusion
This analysis finds that Muni Metro accessibility premiums in San Francisco are highly localized. Homes within ¼ mile of stations retain stronger values, while those ¼–¾ miles away sell for 15–18% less per square foot. Beyond ¾ mile, the effect disappears. Importantly, the results are heterogeneous across subregions: Central and Eastern neighborhoods show clear capitalization of transit access, while the lower-density West exhibits little effect. These findings suggest that the value of transit investment is not uniform, but instead depends on the density and urban form of surrounding neighborhoods.